I recently released MMM-Fintech. It’s a MagicMirror module for displaying consolidated cryptocurrency and traditional investment holdings. It includes real-time pricing, exchange rates, and 24-hour change indicators.
The Problem
I wanted a single view of my portfolio on my MagicMirror—crypto from Coinbase alongside stocks and ETFs from my brokerage. The existing options weren’t quite right. MMM-AVStock worked well for a while, but Yahoo Finance API changes in late 2024 broke historical data and charts. I contributed a fix for the basic functionality (PR #87), but the broader limitations remained. I tried MMM-Jast, but it’s ticker-focused without the consolidated portfolio view I wanted.
So I built my own. I extensively used AI assistance to generate and iterate the code base.
The Solution
MMM-Fintech takes a provider-based architecture approach. Instead of being locked to one data source, different providers handle different asset types:
– **Coinbase CDP API** for cryptocurrency holdings and prices
– **Twelve Data API** for stocks, ETFs, mutual funds, and forex rates
This separation means I can add new providers later without restructuring everything. It also allows different update intervals. Crypto updates every 5 minutes, as it operates in a 24/7 market. Meanwhile, stocks update every 20 minutes during market hours only.
Key Features
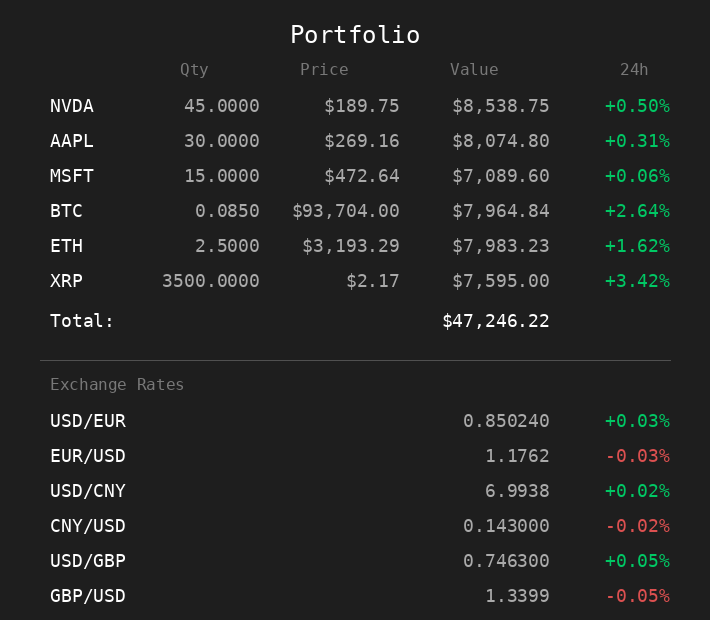
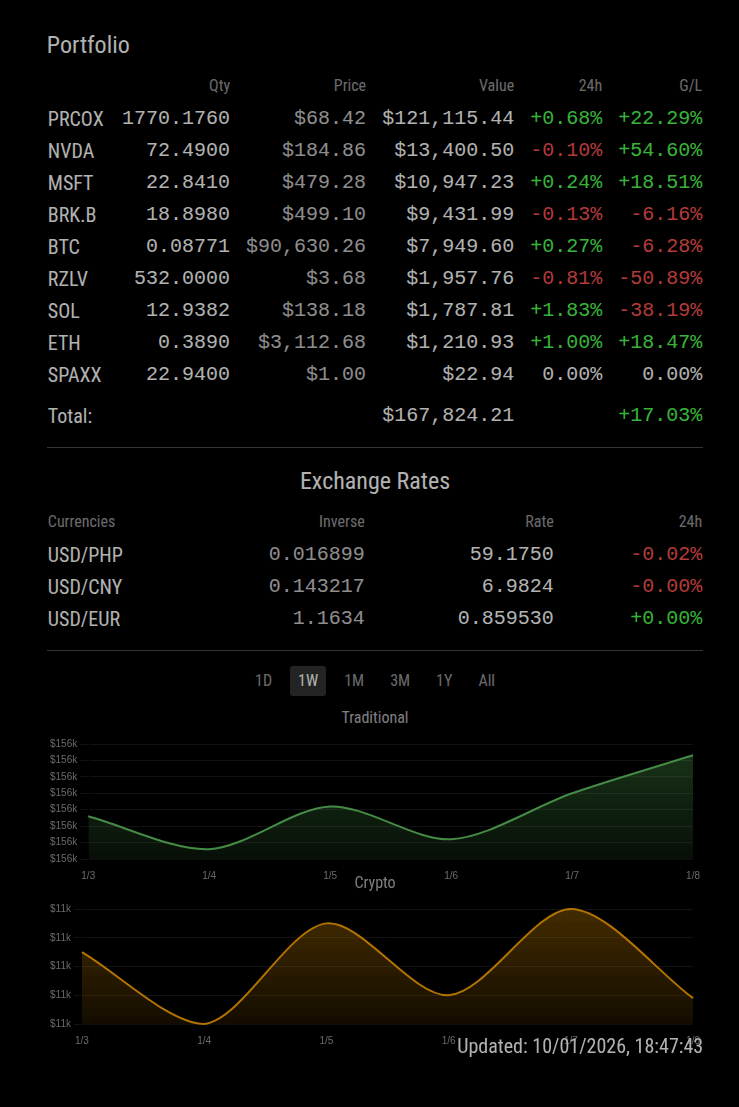
The module displays holdings with quantity, current price, total value, and 24-hour percent change. A separate Exchange Rates section shows forex pairs with their rates and daily movement. Everything rolls up to a portfolio total.
Configuration options include:
– Currency conversion: Show values in USD, EUR, GBP, or other currencies
– Privacy mode: Hide quantities and values, showing only symbols and price changes
– Market hours scheduling: Limit stock/forex API calls to trading hours, reducing unnecessary requests
– Crypto as forex: Show crypto prices in the exchange rates section instead of holdings
– Configurable sorting: By value or alphabetically
Security
API credentials are encrypted at rest using AES-256-GCM. An interactive setup wizard generates the encryption key and walks through credential configuration. No plaintext API keys are stored in config files.
Technical Challenges
The Coinbase CDP API required implementing JWT authentication with ES256 signing—the official SDK didn’t work properly with Secret API keys. I ended up using direct HTTPS requests with the jsonwebtoken library instead.
Market hours scheduling was another interesting problem. Stocks and ETFs only trade Monday-Friday 9:30am-4pm ET, while forex runs 24/5 (Sunday 5pm to Friday 5pm ET). The module tracks these schedules and includes a post-close poll option for one final update after markets close each day.
What’s Next
The roadmap includes charting and performance tracking. Phase 4 will add a total portfolio value chart. This chart is built from daily snapshots. It includes configurable time periods (1D, 1W, 1M, 3M, 1Y, All). Individual holding charts using Twelve Data’s historical price API are also planned. The goal is local Chart.js rendering with minimal storage overhead—about 1KB per daily snapshot.
Further out, I’m considering Plaid integration for automatic brokerage holdings sync, cost basis tracking, and benchmark comparisons.
**Credits
This project builds on lessons learned from other MagicMirror modules. MMM-AVStock by lavolp3 was my starting point for understanding stock data display. The MagicMirror platform itself, created by Michael Teeuw, makes all of this possible with its elegant module architecture.
Resources
The module is available on GitHub: https://github.com/sonnyb9/MMM-Fintech
For other MagicMirror modules and inspiration, check out MagicMirror.builders—a community-maintained directory of third-party modules organized by category.
If you’re building a MagicMirror and want consolidated portfolio tracking, give MMM-Fintech a try. Issues and contributions welcome on GitHub.
Update: I’ve released a new version. Here are the release notes.
[0.8.0] – 2026-01-09
Added
- Portfolio Performance Charts: Visual tracking of portfolio value over time
- Area chart with gradient fill
- Hourly snapshots (rolling 48 hours) for 1D view
- Daily snapshots for 1W, 1M, 3M, 1Y, All views
- Chart.js integration via CDN
- Chart Configuration Options:
showCharts– Enable chart display (default: false)chartMode– “combined” / “separate” / “exclude-crypto”chartPeriod– “1D” / “1W” / “1M” / “3M” / “1Y” / “All”showPeriodSelector– Show period buttons for touch devices (default: false)historyRetention– Days to retain daily history (default: 1825 / 5 years)
- History Storage: Local
history.jsonfile for snapshot data- ~600 bytes per snapshot (10 holdings)
- ~250 KB after 1 year, ~1.1 MB after 5 years
Changed
- Price updates now record hourly snapshots for chart data
- Holdings sync now records daily snapshots for chart data

Leave a comment